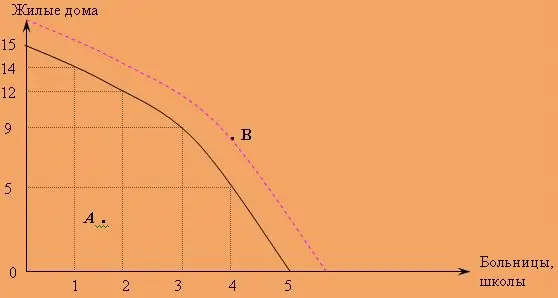
The production opportunity curve is a common model that can be used to reflect how much of one good we have to give up in order to get some of the other good. So how do you build such a model?

It is necessary
Paper, task text, ruler, pen, pencil, eraser
Instructions
Step 1
Study the terms of the assignment carefully. It can be different. Try to find out what the author of the problem requires of you. The task may simply need to draw an approximate graph of the production capability curve, or build an accurate graph and use it to find any values at a given point. In all cases, you must first build the graph itself.
Step 2
The graph is performed in the Cartesian plane. This means that the graph will have two rays - horizontal and vertical, coming out of the origin. Mark the zero point, marking it with the letter O. Draw two rays from it. On one, the amount of one good will be noted, and on the second another. At the ends of the rays, write what kind of benefit will be marked on it.
Step 3
Select a scale for the drawing. It is much easier to draw a drawing on checkered paper, since every two squares are one centimeter. For clarity, you can write the numbers with a red pen. The graph itself is best drawn with a simple pencil so that in case of an error it can be easily erased and corrected. Now refer to the text of the problem and find in what form the curve of production possibilities is given. It can be given as a linear equation. Then it is necessary to draw a small plate in which to enter all these functions for a given value of the argument. After that, use the data in the table to build a graph.
Step 4
The task can simply be given values. Then you just need to plot them in points on the graph and build a graph. You can also first get an equation and plot a graph from it.


