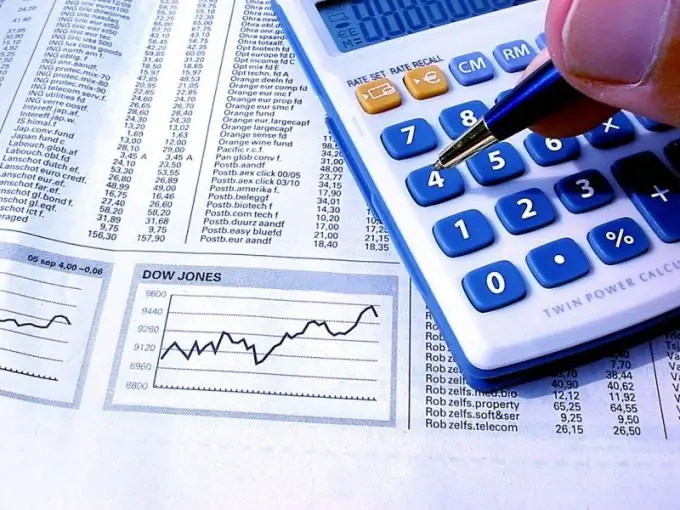
A graph is a visual representation of the change in the parameters of a phenomenon over time. This is a graphical display of statistical data that allows you to visualize dynamic processes, organize them, analyze and draw conclusions. To build a graph, you need to collect a certain amount of data. The more there are, the more accurate and reliable the conclusions will be.

Instructions
Step 1
The chart can be linear, in the form of bars and so-called "Japanese candlesticks". The most popular and most often used type is a line chart, when one time count corresponds to one quantitative indicator. For most analytical calculations, this is quite enough. To build such a graph, you need indicators for specific time intervals. For example, sales volumes for each day. It is better to analyze charts over several years in order to identify general trends.
Step 2
Compare several charts for the year. Determine how the parameters change depending on the season, depending on what is the object of research. For example, sales of soft drinks increase significantly during the summer months. The same applies to finishing materials, since the population also repairs apartments in the warm season. Such seasonal fluctuations will make it possible to adjust the supply of goods to the warehouse in such a way that there would be no overstocking or shortages.
Step 3
By analyzing the daily chart, you will be able to notice not only seasonal fluctuations in demand. If its line is sawtooth, then look at which days of the week the sales peaks fall. Most likely it is Saturday and Sunday. These projected periodic highs in shopper activity will also help you factor this into your store's operations.
Step 4
If you collect data for each type of product, you can look at the trend charts - an upward or downward trend, covering the fluctuation in demand for a product over a long time. The trend is distinguished by a sequence of highs and lows, but in an uptrend, each next pair of highs and lows is located above the previous one. The trend will help you determine which product is growing in popularity and which is declining.


